User reporting gives admins a live view of your workforce, built directly from User Management data. No configuration or syncing is needed: if your employee records are up to date, your reports are too.
You will find it under Admin > User Reporting. It has two tabs: Analytics and Demographics. This article walks through both and explains the one thing that matters most for accurate numbers: employee start and end dates.
The golden rule: start and end dates drive everything
Most numbers on the Analytics tab are calculated from each employee's start date and end date, which you set in User Management (or through your user import).
- An employee counts towards headcount from their start date until their end date.
- An employee with no end date is treated as still employed.
- An employee with no start date cannot be placed on the timeline at all, so they are left out of the headcount chart and tenure.
This means two habits keep your reports accurate:
- When someone joins, give them a start date. Imports usually handle this for you.
- When someone leaves, set their end date. Deactivating their account removes their access, but it does not tell the reports that they left. Without an end date, they will keep counting towards headcount forever, and they will never show up as a leaver in your attrition rate.
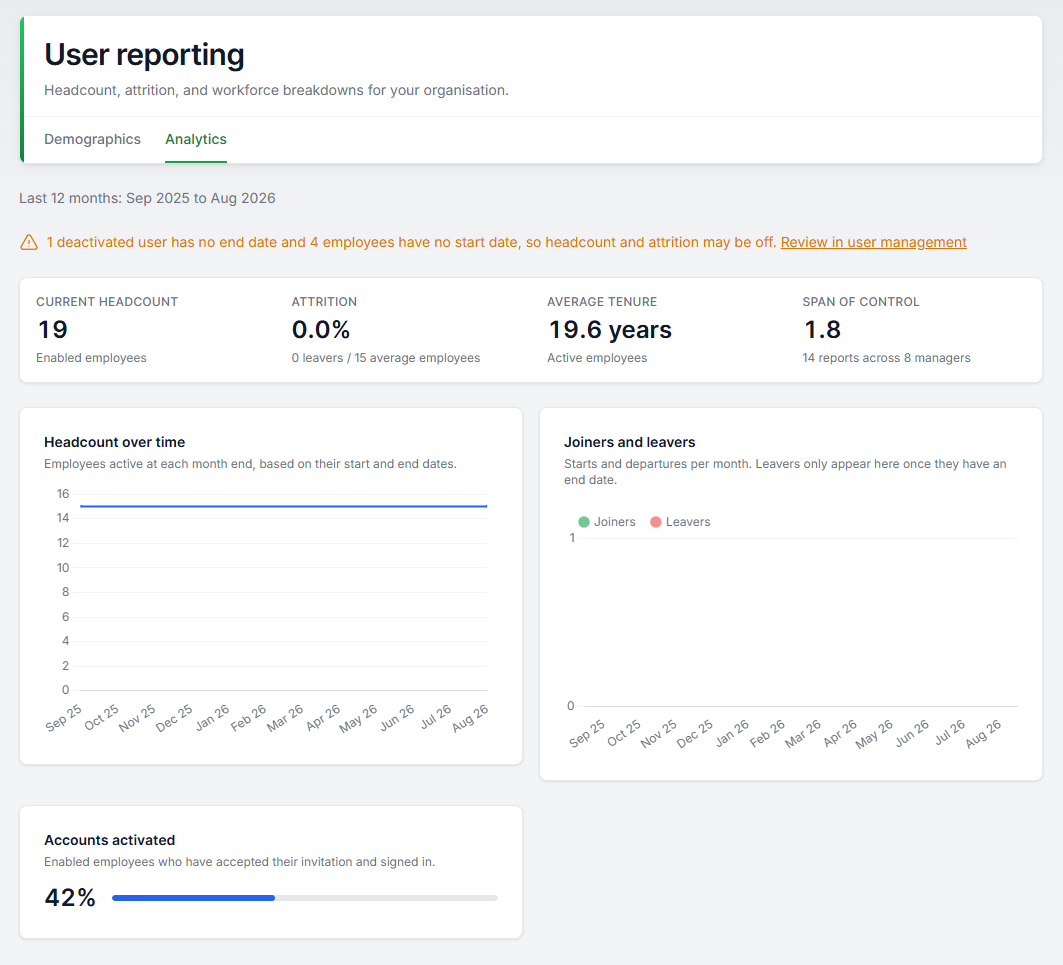
If TeamMaven detects either gap in your data, the Analytics tab shows a notice like this, with a link to review the affected people in User Management.
Fix the dates it points to and the notice disappears on its own.
The Analytics tab
The Analytics tab covers the last 12 months, shown at the top of the page.
The snapshot numbers
Current headcount is the number of enabled employees right now. This is the one number that does not depend on dates, so it is always accurate.
Attrition is the percentage of your workforce that left over the last 12 months. It is calculated as leavers divided by your average number of employees for the period, and the working is shown under the number. A leaver is anyone whose end date falls inside the last 12 months, so this number is only as good as your end dates.
Average tenure is the average time your current employees have been with you, in years, measured from each person's start date.
Span of control is the average number of direct reports per manager. Only enabled employees count on both sides, so people who have left do not distort the ratio.
Headcount over time
This chart shows how many employees were active at the end of each month, worked out from start and end dates. Use it to see growth and seasonality at a glance.
A common surprise: if the line never goes down even though people have left, it almost always means leavers were deactivated without an end date. Set their end dates and the history corrects itself, including past months.
Joiners and leavers
This chart breaks the same period into monthly starts and departures. It is the quickest way to sanity-check your data: if you know people left in a month that shows zero leavers, their end dates are missing.
Accounts activated
This one is about TeamMaven adoption rather than your workforce: the percentage of enabled employees who have accepted their invitation and signed in. If it is low, re-sending invitations from User Management is the usual fix.
The Demographics tab
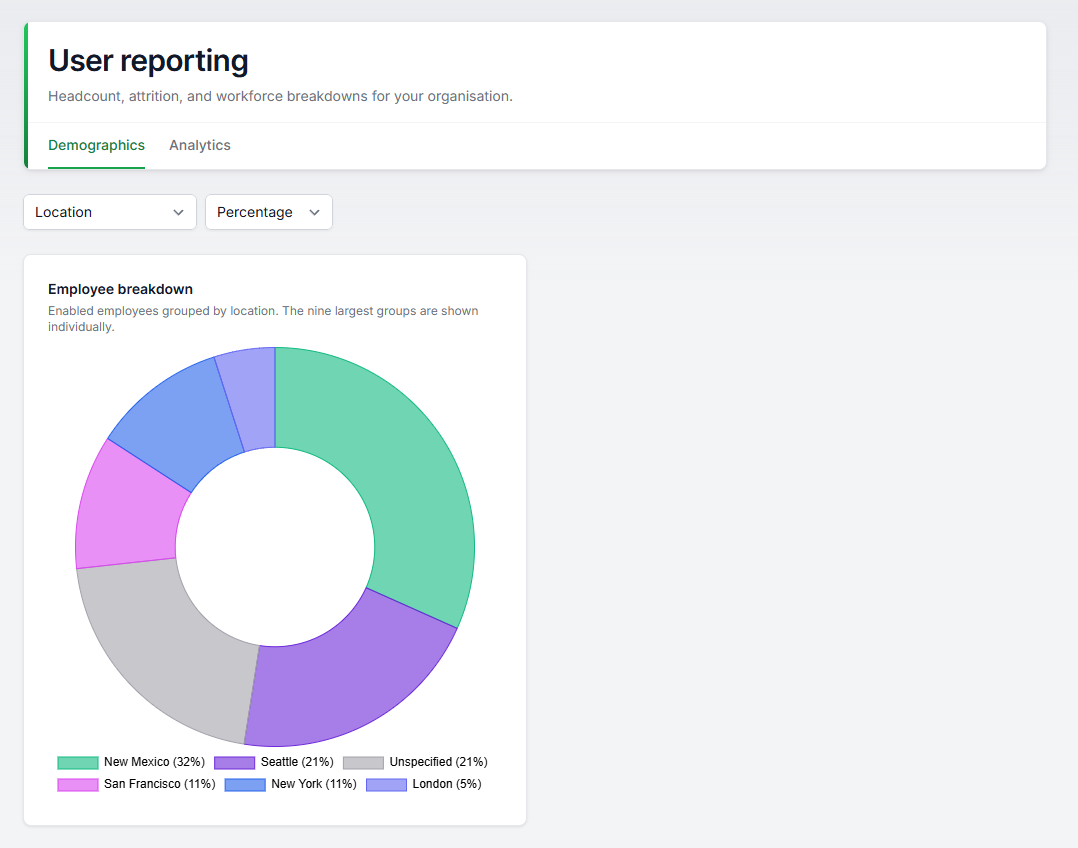
The Demographics tab breaks down your currently enabled employees by whichever attribute you choose: location, department, division, management level, tenure, age group, employment type, or job title.
Pick an attribute from the first dropdown, and choose whether to see percentages or counts in the second. The nine largest groups are shown individually, and anything smaller is grouped into "The Rest". Employees with no value for the chosen attribute appear as "Unspecified", which doubles as a handy data-quality check.
A few notes:
- Tenure and age group are calculated from start dates and birth dates, so they follow the same rule as everything else: they are only as accurate as the data behind them.
- Gender and ethnicity only appear as options if your organisation has enabled sensitive demographics under Admin > Organisation > Privacy & compliance. This is an audited, GDPR-aware setting, enforced on our servers, not just hidden in the menu.
- The breakdown always reflects your workforce today. It does not show change over time.
Quick checklist for accurate reports
- Every employee has a start date.
- Everyone who has left has an end date, even if their account was deactivated long ago.
- Employee attributes (department, location, and so on) are filled in, so "Unspecified" stays small.
- Managers are assigned in User Management, so span of control reflects your real structure.
If a number ever looks wrong, start with the amber notice on the Analytics tab. In almost every case, the fix is a missing date in User Management.
Was this article helpful?
That’s Great!
Thank you for your feedback
Sorry! We couldn't be helpful
Thank you for your feedback
Feedback sent
We appreciate your effort and will try to fix the article